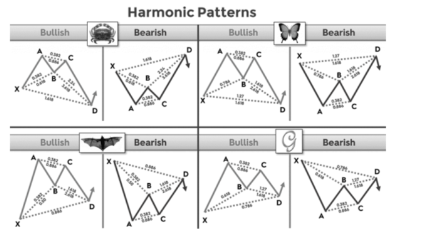
Harmonic Price Patterns are a class of chart patterns that traders use to predict future market movements by identifying specific price structures. These patterns are based on Fibonacci retracement and extension levels, creating geometric shapes that help traders spot potential reversal points in the market. Here are some of the key Harmonic Price Patterns:
Bullish Gartley
Bearish Gartley
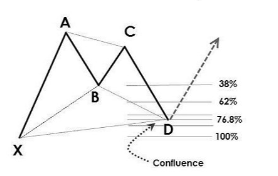
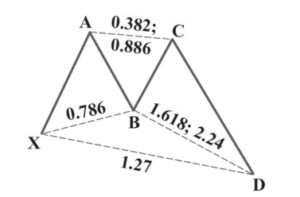
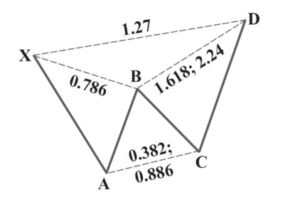
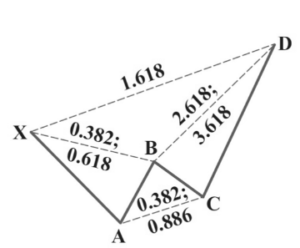
Gartley Pattern:The Gartley pattern is a five-point pattern (X-A-B-C-D) that occurs when a trend is temporarily interrupted by a correction. It is named after H.M. Gartley, who introduced it in his book “Profits in the Stock Market”. The ideal Gartley pattern consists of specific Fibonacci ratios:
AB should retrace 61.8% of XA.
BC should retrace between 38.2% and 88.6% of AB.
CD should be either 127.2% or 161.8% extension of BC.
CD should also be 78.6% retracement of XA.
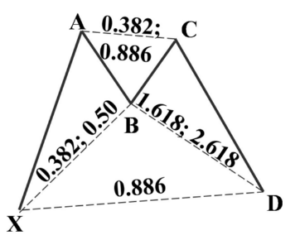
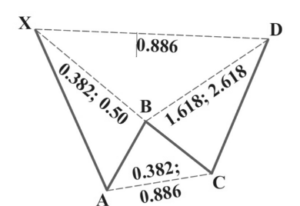
Bat Pattern:The Bat pattern is similar to the Gartley pattern but with different Fibonacci ratios:
AB should retrace 38.2% or 50% of XA.
BC should retrace between 38.2% and 88.6% of AB.
CD should be 161.8% extension of BC.
CD should also be 88.6% retracement of XA.
Bullish Bat
Bearish Bat
Bullish Butterfly
Bearish Butterfly
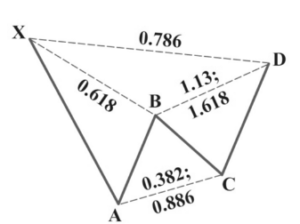
Butterfly Pattern: The Butterfly pattern helps identify potential reversal zones and is characterized by:
AB should retrace 78.6% of XA.
BC should retrace between 38.2% and 88.6% of AB.
CD should be 161.8% to 261.8% extension of BC.
CD should also be 127.2% or 161.8% extension of XA.
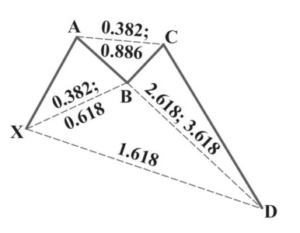
Crab Pattern:The Crab pattern is known for its precision and involves the following Fibonacci ratios:
AB should retrace 38.2% or 61.8% of XA.
BC should retrace between 38.2% and 88.6% of AB.
CD should be 224% to 361.8% extension of BC.
CD should also be 161.8% extension of XA.
Bullish Crab
Bearish Crab
Bullish Shark
Bearish Shark
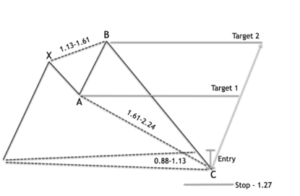
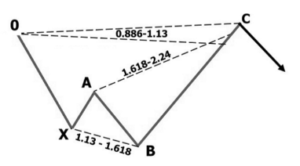
Shark Pattern:The Shark pattern is a newer harmonic pattern and has different Fibonacci levels:
AB should retrace between 113% and 161.8% of XA.
BC should retrace 50% of AB.
CD should be 88.6% retracement of XA.
Cypher Pattern:The Cypher pattern is another advanced harmonic pattern with the following ratios:
AB should retrace between 38.2% and 61.8% of XA.
BC should retrace between 113% and 141.4% of XA.
CD should be 78.6% retracement of XC.
Trading with Harmonic Patterns
When trading harmonic patterns, the key is to identify the pattern accurately and confirm it with other technical indicators or price action signals. Here’s a general approach to trading these patterns:
Identify the Pattern:Use a charting tool to spot the potential harmonic pattern and verify the Fibonacci ratios.
Wait for Completion:The pattern is not complete until the D point is reached.
Confirm the Reversal:Look for additional signals, such as candlestick patterns, RSI, or MACD, to confirm the potential reversal.
Enter the Trade:Once confirmed, enter the trade at the D point, with a stop-loss placed beyond the next Fibonacci level or a recent high/low.
Set Profit Targets:Use Fibonacci extensions or previous support/resistance levels to set profit targets.
Harmonic Price Patterns can be a powerful tool for traders, but they require practice and a good understanding of Fibonacci levels. As with any trading strategy, it’s essential to manage risk and confirm signals before entering trades.