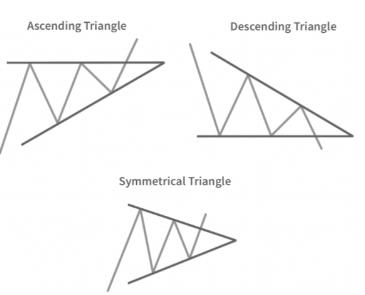
Chart patterns are formations created by the price movements of a security on a chart and are used in technical analysis to predict future price movements. Here are some common chart patterns:
Continuation Patterns
These patterns suggest that the price trend will continue in its current direction once the pattern is completed.

Triangles:
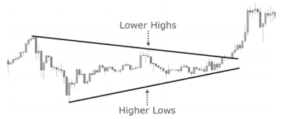
– Symmetrical Triangle: Formed by converging trend lines, suggesting a breakout in the direction of the existing trend.
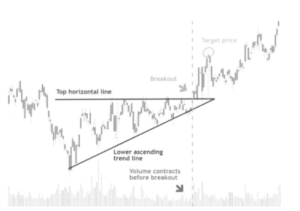
– Ascending Triangle: Characterized by a flat upper trend line and a rising lower trend line, indicating a potential breakout to the upside.
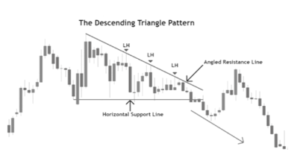
– Descending Triangle: Features a flat lower trend line and a descending upper trend line, indicating a potential breakout to the downside.
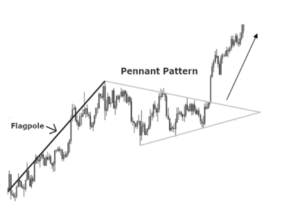
Flags and Pennants:
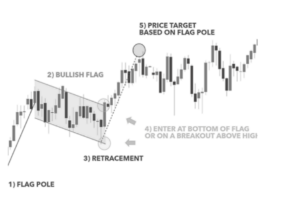
– Flag: A small rectangle that slopes against the prevailing trend, followed by a continuation of the trend.
– Pennant: Similar to a flag but has converging trend lines, forming a small symmetrical triangle.

Rectangles:Formed by parallel support and resistance levels, indicating a period of consolidation before the trend resumes.
Reversal Patterns
These patterns indicate that the current trend is likely to reverse once the pattern is completed.

Head and Shoulders:
– Head and Shoulders Top: A pattern with three peaks, where the middle peak (head) is higher than the two shoulders, signaling a bearish reversal.
– Inverse Head and Shoulders: A pattern with three troughs, where the middle trough (head) is lower than the two shoulders, signaling a bullish reversal.

Double Top and Double Bottom:
– Double Top: Two peaks at roughly the same price level, indicating a bearish reversal.
– Double Bottom: Two troughs at roughly the same price level, indicating a bullish reversal.
Triple Top and Triple Bottom:
– Triple Top: Three peaks at roughly the same price level, indicating a bearish reversal.
– Triple Bottom: Three troughs at roughly the same price level, indicating a bullish reversal.

Rounding Bottom:A “U”-shaped pattern indicating a slow transition from a downtrend to an uptrend.

Cup and Handle:A “U”-shaped pattern followed by a smaller consolidation, indicating a bullish continuation after the breakout from the handle.

Neutral Patterns
These patterns can indicate either a continuation or a reversal, depending on the breakout direction.
- Symmetrical Triangle:Can signal either a continuation or a reversal, depending on the direction of the breakout.
- Wedge:
- Rising Wedge: A bearish pattern that slants upward against the prevailing trend.
- Falling Wedge: A bullish pattern that slants downward against the prevailing trend.
Understanding and recognizing these chart patterns can help traders and analysts make better-informed decisions by anticipating potential market movements.